
Here is my structured technical report and summary based on the meeting notes taken on the
28th May 2025 regarding the Plumpton College data sessions teams meeting:
Attendees of the meeting:
Paul Martin paul.martin@forestrock.co.uk
David Stokes david.stokes@plumpton.ac.uk
John Cassidy john@archipelagos-labs.com
Nikolaos Polatidis n.polatidis@brighton.ac.uk
Jennifer Wells J.Wells@brighton.ac.uk
Imran Rafiq m.rafiq@brighton.ac.uk
Paul Jellicoe pj@vinewatch.co.uk
Sam Howe (Unverified) was invited to the meeting.
David Blake david.blake@plumpton.ac.uk
Steve Prowse steve.prowse.ext@boldyn.com
Sam Howe (Didn't have an email address)
Sabastian Holmes sebholmes@vinewatch.co.uk
Sam Linter sam.linter@plumpton.ac.uk
Sara McGreal Sara.McGreal@westsussex.gov.uk
Agenda:
|
Agenda Item |
Lead |
|
Welcome and Introductions |
WSCC |
|
Project Post March – Data Focus |
WSCC |
|
Viewing the Data
|
Archipelagos Lab |
|
Analysis of the Data |
University of Brighton |
|
Baselining the Data |
University of Brighton |
|
Wrap Up & Summarise Actions |
WSCC |
Technical Report: Plumpton College Data Sessions
Prepared by: Paul Martin
Date: 28 May 2025
1. Overview
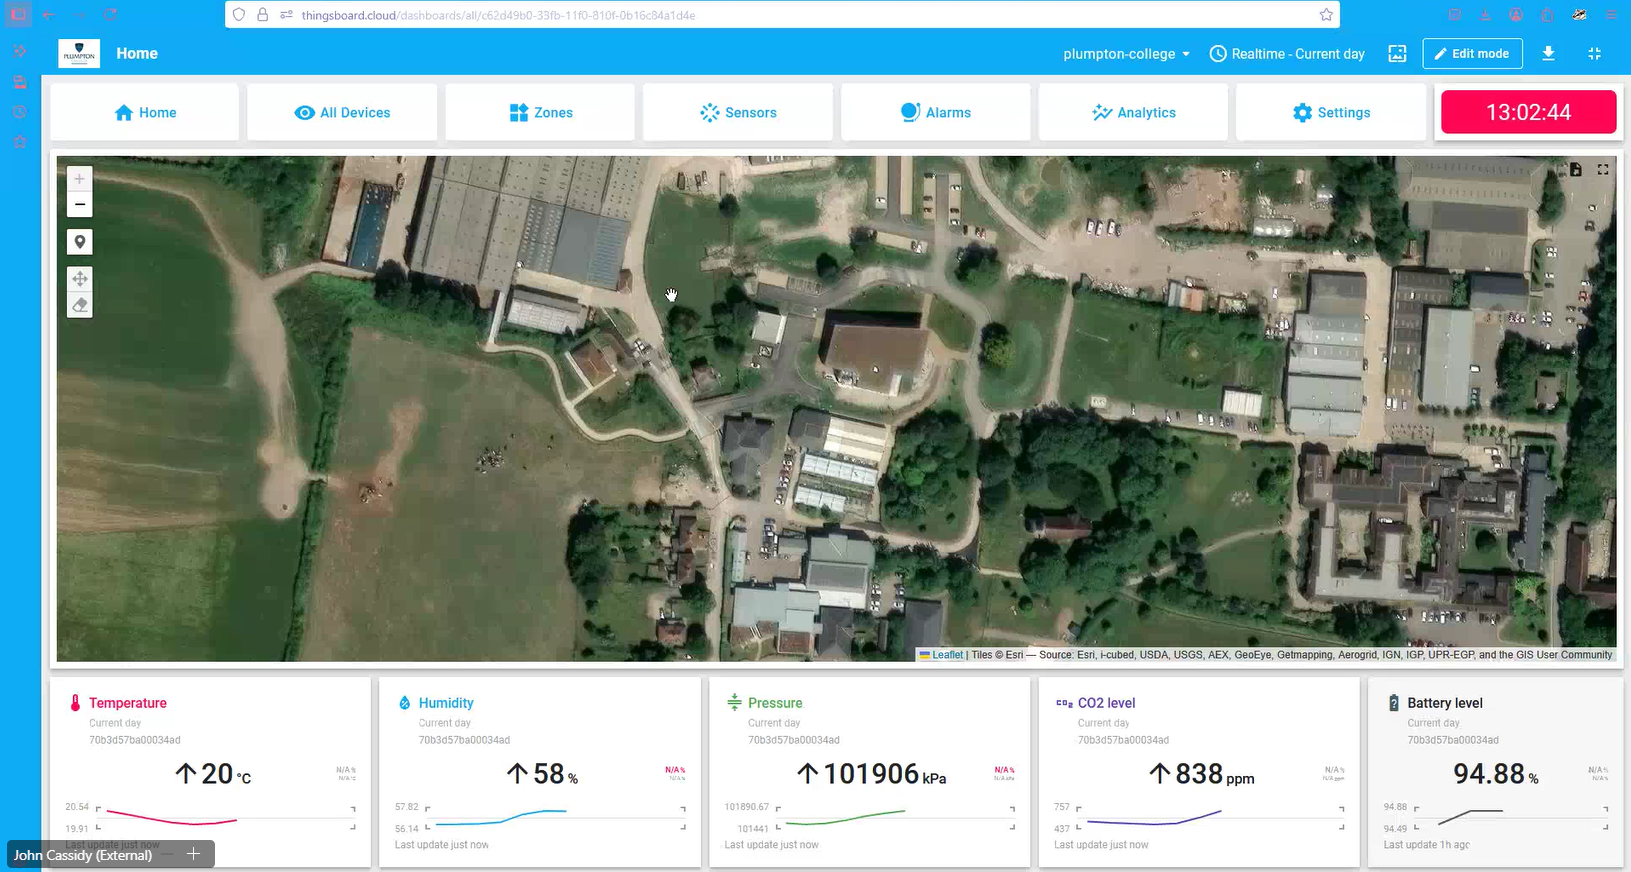
The meeting, led by Gregory Merrett of West Sussex Council: gregory.merrett@westsussex.gov.uk tallked about the project and funding which I have added some context below: Gregory then handed over to David Stokes and John Cassidy from ARCHIPELAGOS LABS, who introduced and demonstrated a proposed digital dashboard layout for Plumpton College's vineyard monitoring project which had zero live data and was entirely simulated as they admitted they had no live sensors that they could share with us.
As a comparison here is a screenshot from one of our client vineyards in the UK with live data today.
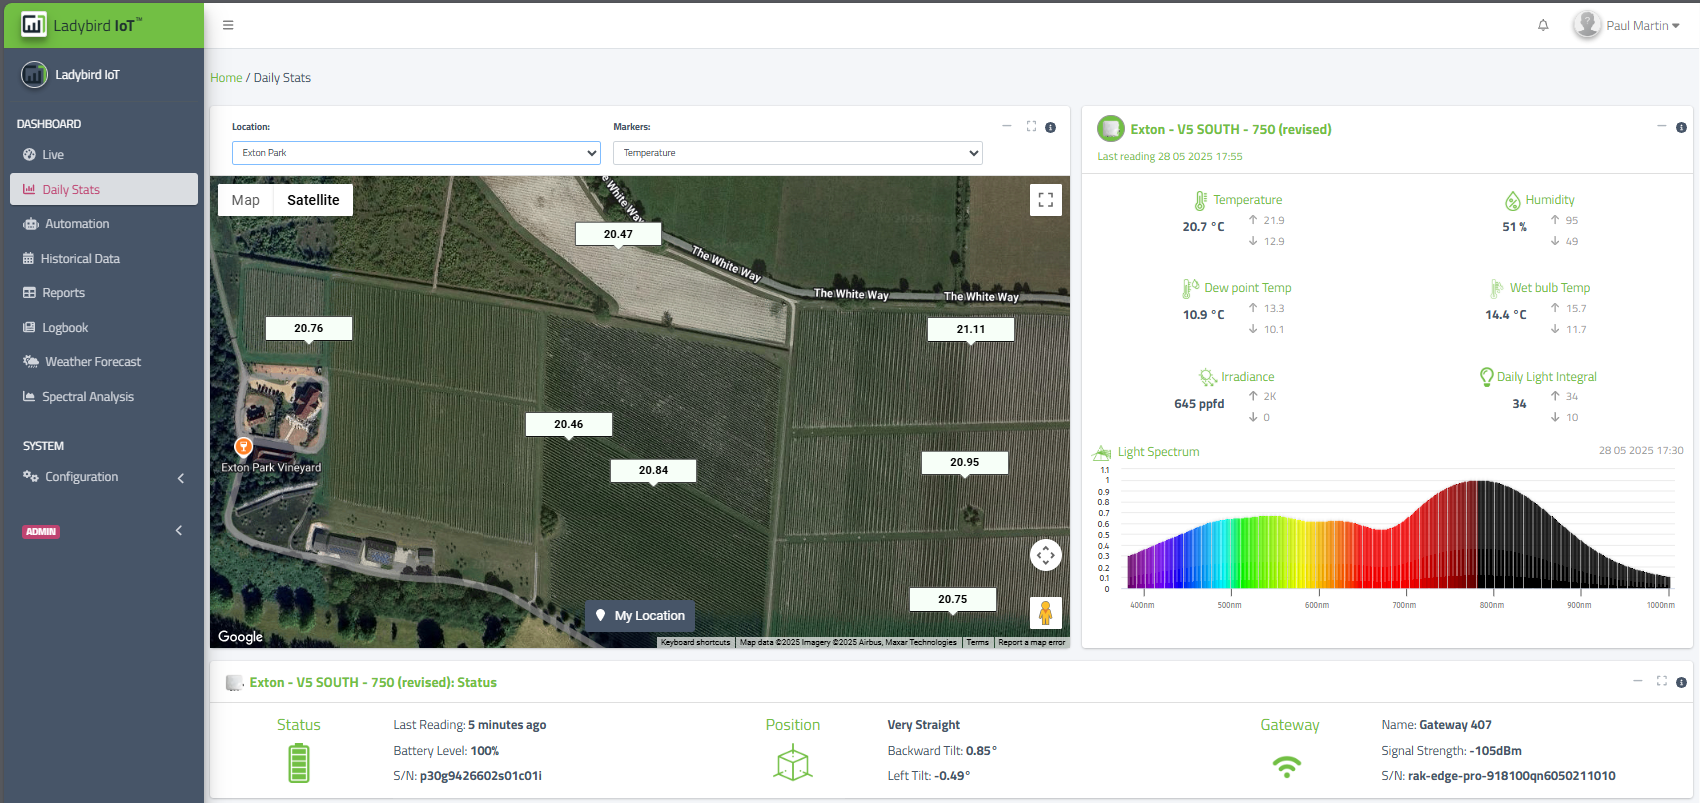
The Light Spectrum graph in our dashboard is a standout feature because it provides a data-driven window into plant physiology and growth potential, especially in viticulture, where light quality and duration are critical to vine development and grape quality.
Why the Light Spectrum Graph Is So Important:
Predicting Growing Days and Hours
-
The graph captures real-time and historical data on the intensity and composition of light
(e.g., UV, PAR, red, far-red). -
By analysing this data, we can accurately estimate the number of effective growing hours per day, not just daylight hours, but those with photosynthetically active radiation (PAR) that actually drive plant growth.
-
This allows for predictive modelling of:
-
Bud burst and flowering times,
-
Fruit set and ripening windows,
-
Harvest readiness.
-
Archipelagos Labs never mentioned anything about this important Light Spectrum sensor in their demonstration, and something I feel is a significant oversight on their part, especially considering how central it is to the Plumpton vineyard project’s predictive capabilities.
The Light Spectrum graph is not just another data point, it’s a core enabler of our ability to forecast growing conditions, optimize vineyard operations, and demonstrate the value of 5G-enabled precision agriculture.
Optimising Vineyard Management
-
Knowing the quality of light helps in canopy management (e.g., leaf thinning, trellising) to maximize light penetration.
-
It supports precision irrigation and nutrient scheduling, aligning inputs with periods of peak photosynthetic activity.
-
You can also compare light profiles across vineyard blocks, identifying microclimates and tailoring interventions accordingly.
Climate Resilience and Sustainability
-
With climate variability increasing, the ability to track and respond to light fluctuations is vital.
-
The graph helps anticipate frost risk (e.g., sudden drops in solar radiation) and heat stress (e.g., excessive UV exposure), enabling proactive measures.
Educational and Research Value
-
For Plumpton College, this graph is a teaching tool and a research asset. Students and fellow researchers can:
-
Correlate light data with vine phenology,
-
Study the impact of light on grape chemistry,
-
Develop new models for light-use efficiency in vineyards.
-
Our ability to monitor this sensor that is built into every Ladybird sets your project apart from other agri-tech pilots, especially in the context of DSIT’s goals around replicable, scalable innovation.
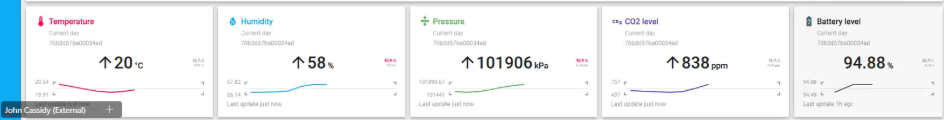
The at a glance feature of the Archipelagos Labs demonstration featured temperature, humidity, pressure, CO2 level, which is something we currently do not monitor but can add this into our dashboard when our V4 Ladybird becomes available and battery level, which is something we can also display.
Our at a glance view is on a separate tab to our main page and is displayed under live readings and as you can see we can show actual sensor names, along with wind speed, wind direction (subject to a weather station installed) as well as temperature, humidity, irradiance in W/m2, radiation sum, soil temperature and also leaf wetness where installed. We can also toggle between a 6hr and 12hr forecast in the at a glance window.
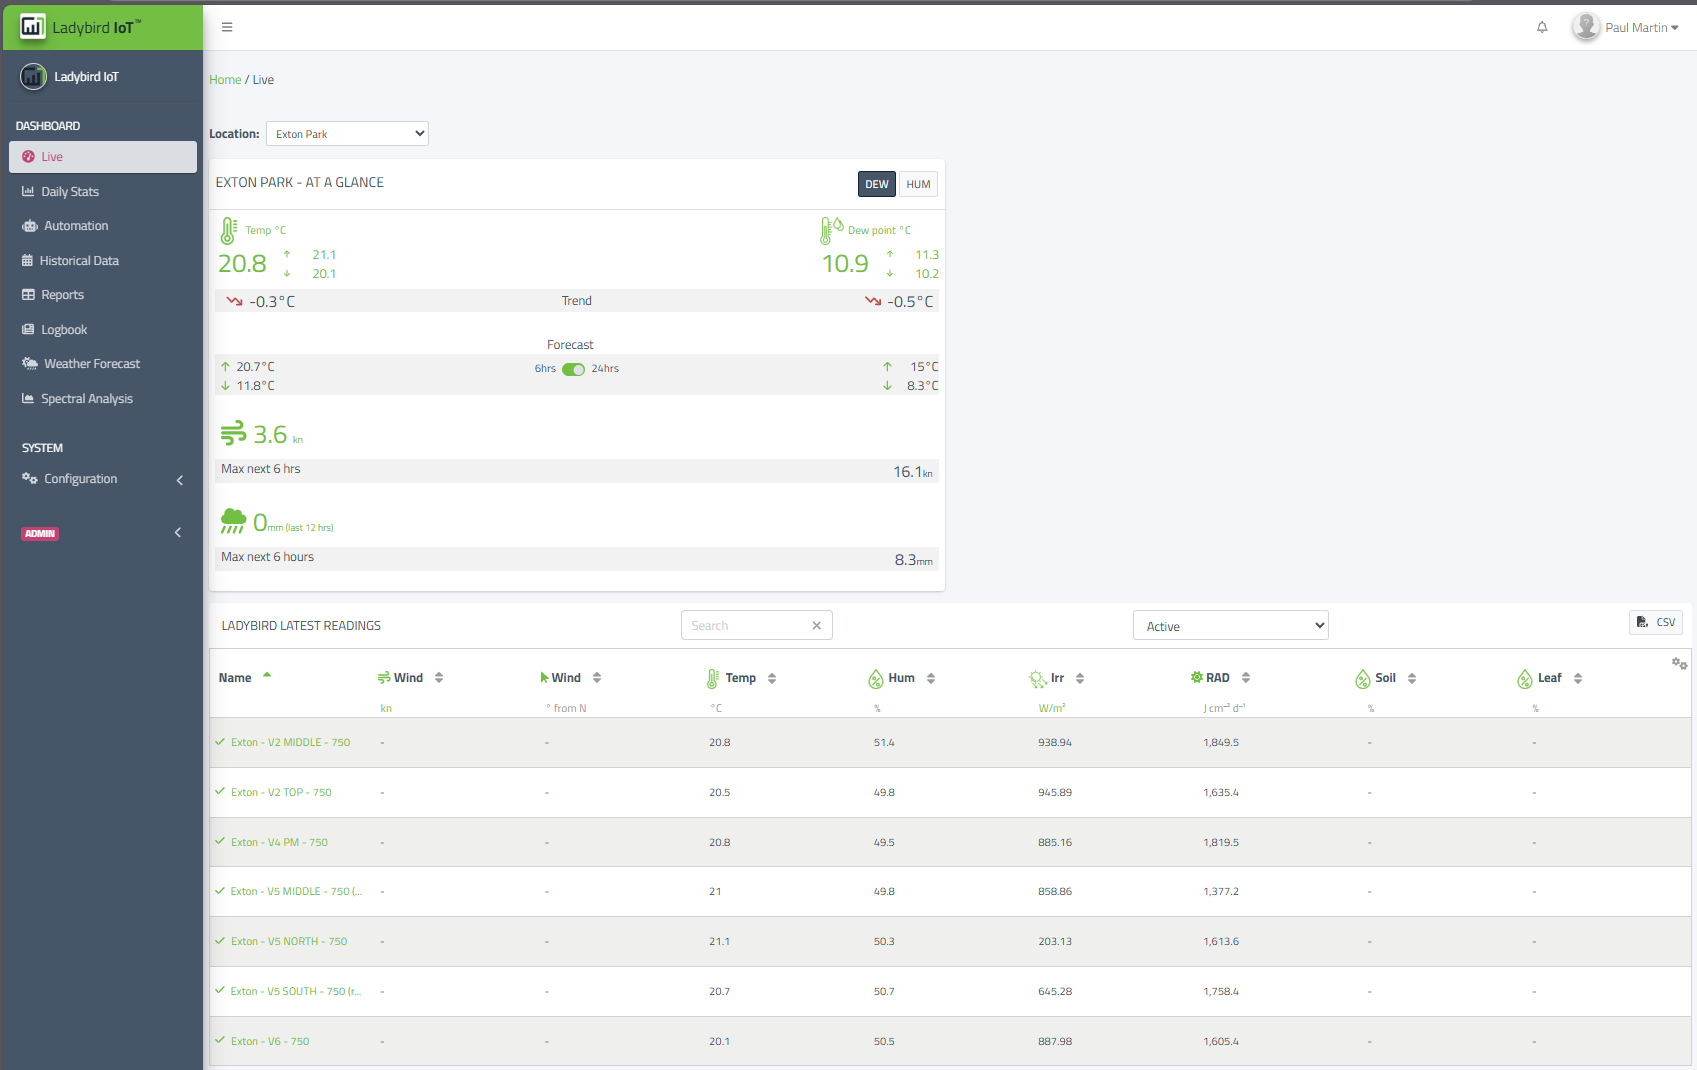
The Archipelagos Labs dashboard however was NOTED to be somewhat limited in sensor data.
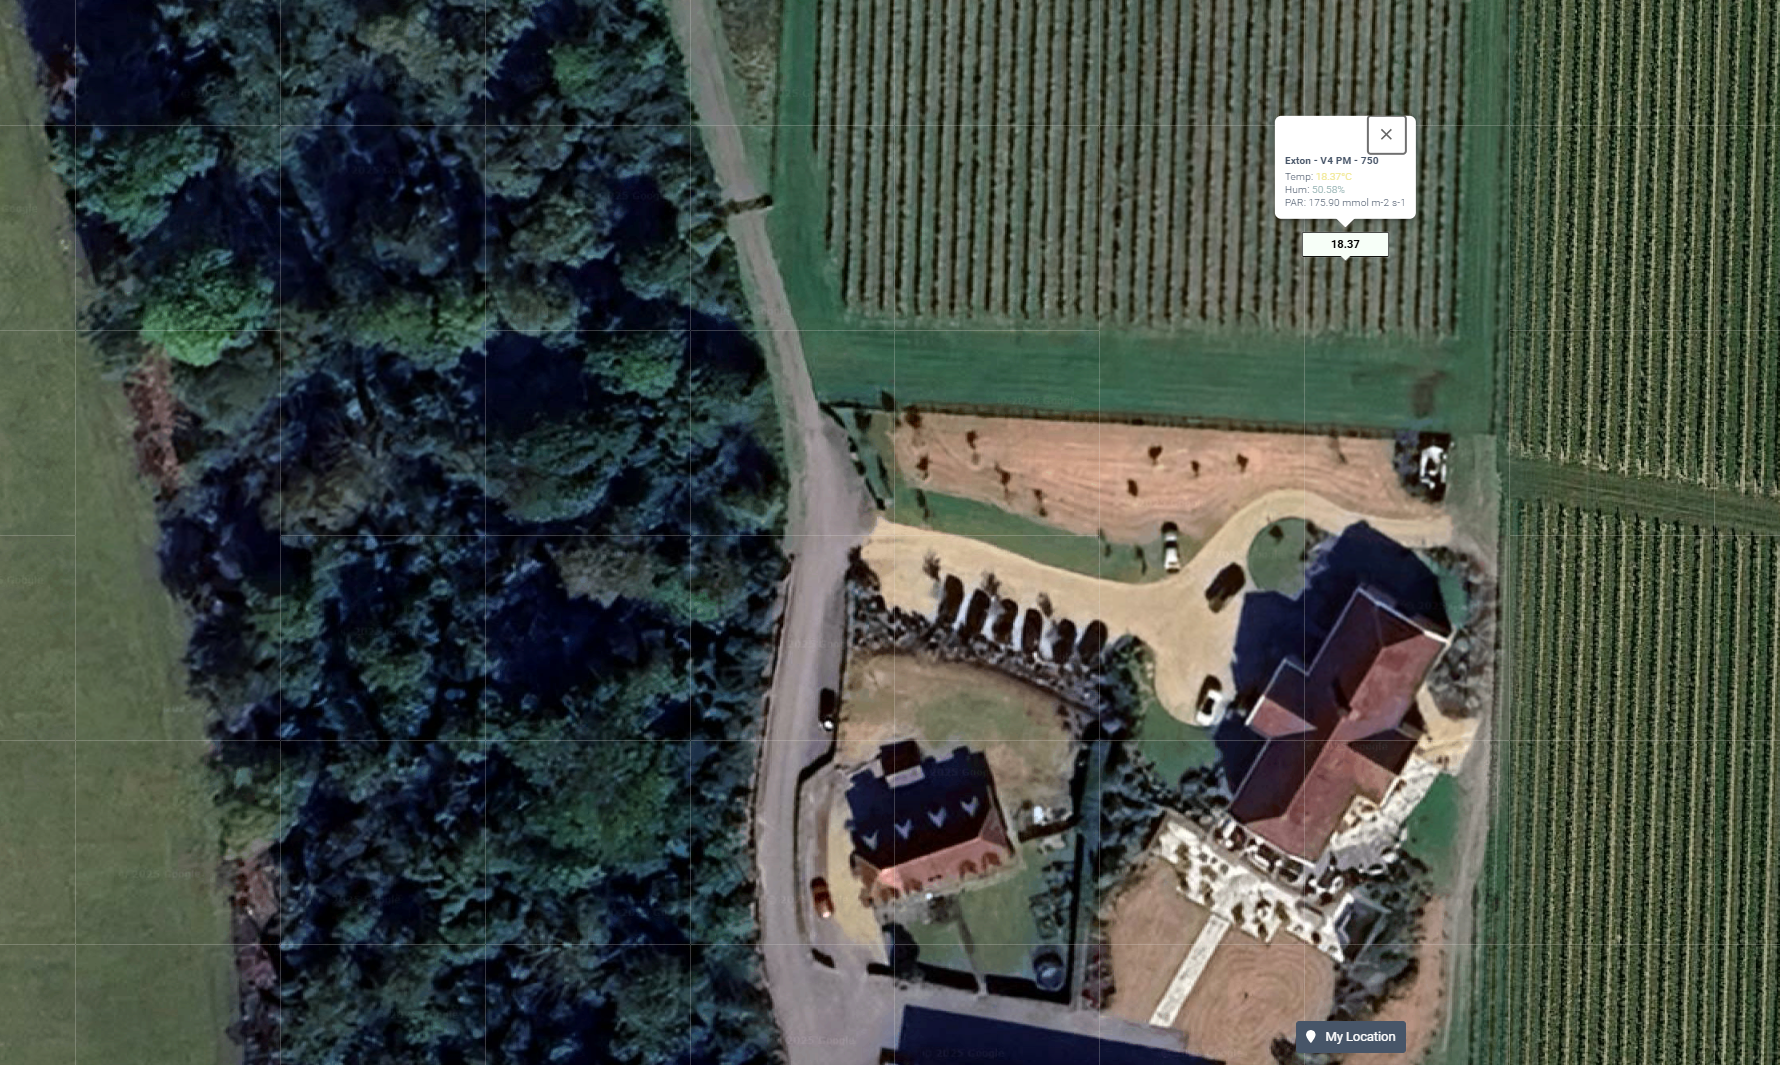
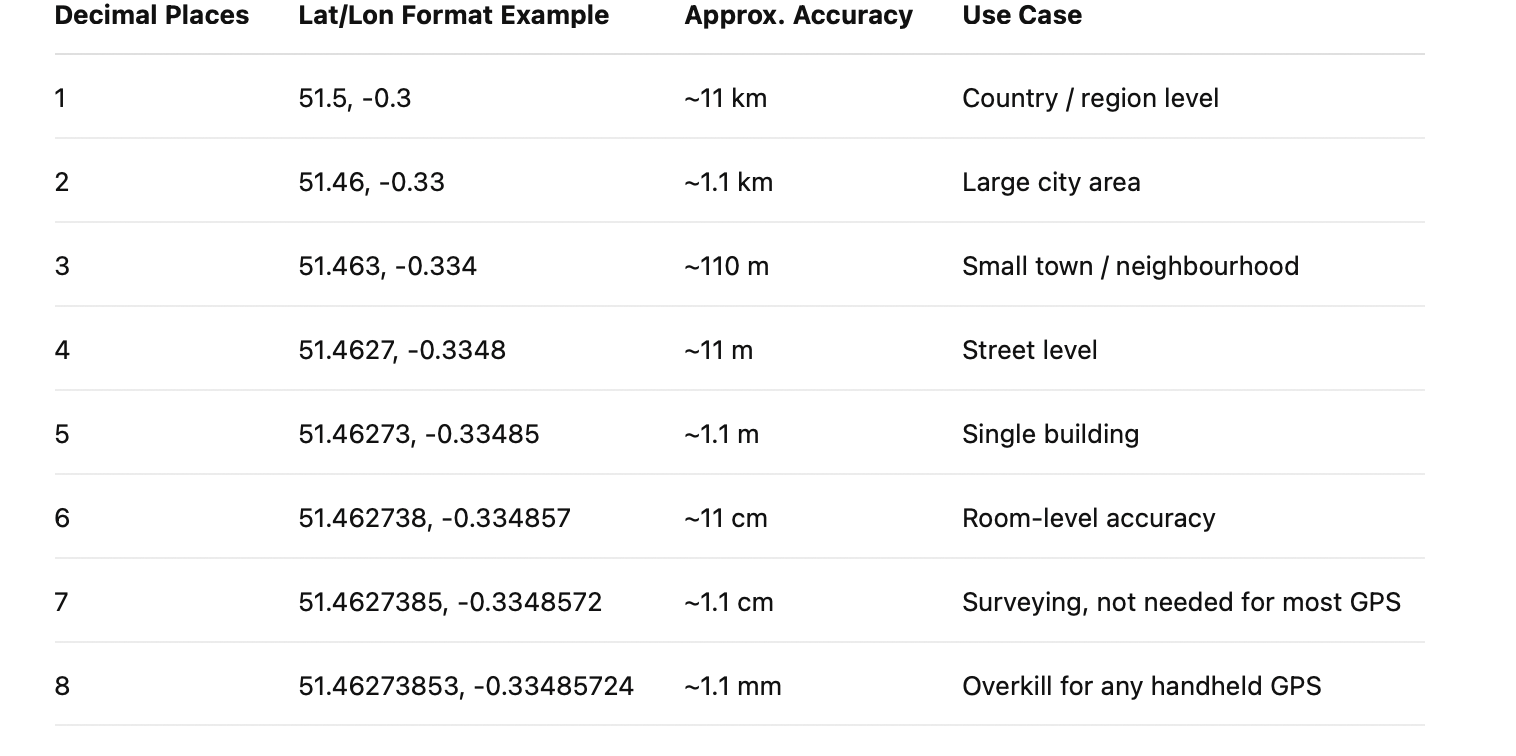
If you click on one of the sensor names highlighted green in our dashboard, you are taken directly to the setup page for the Ladybird where we display its unique serial number, as well as the latitude and longitude down to 4 decimal places so we are able to show a street level location on a map of around 11m accuracy on the digital map within the dashboard.
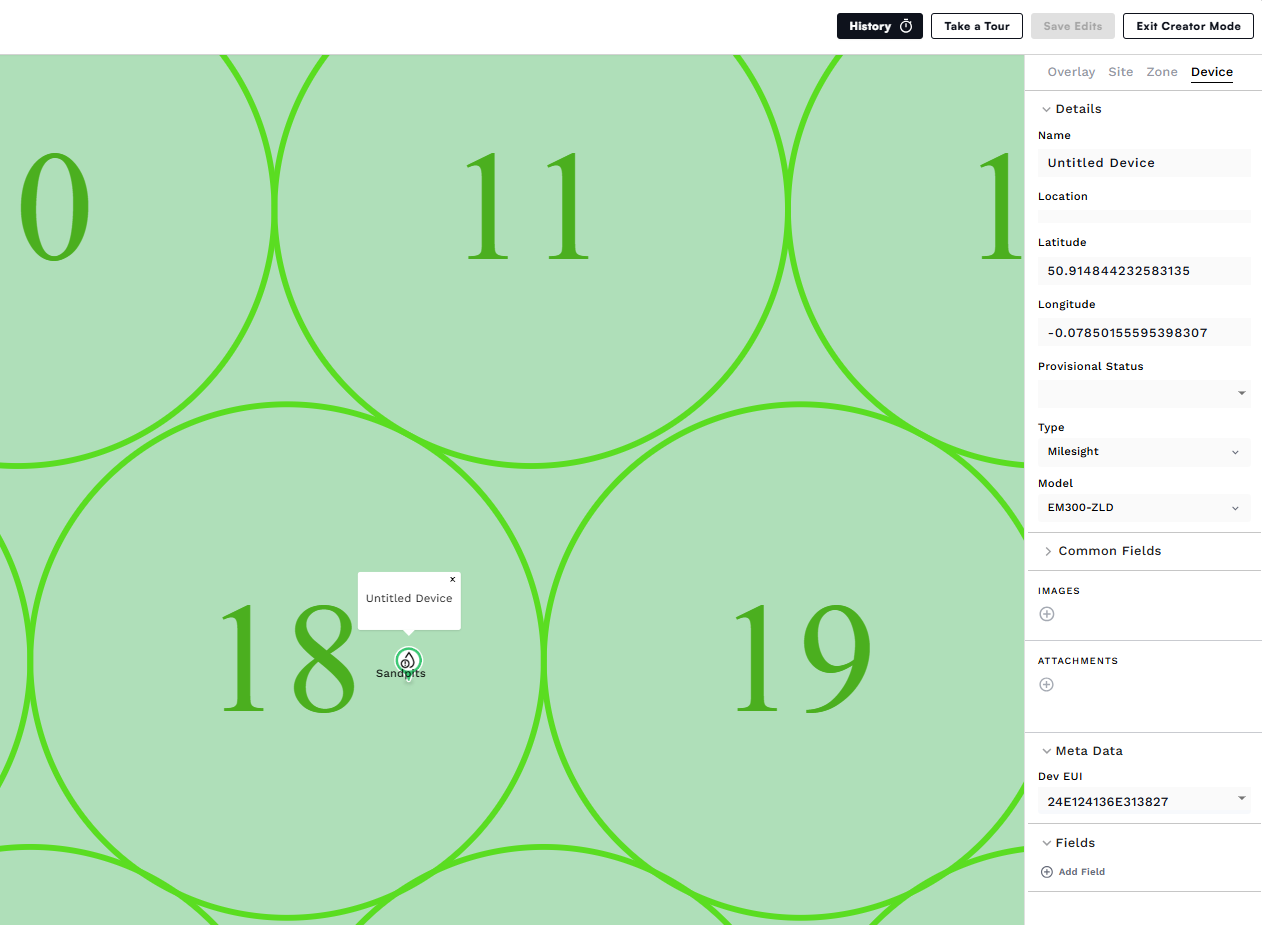
This is as far as the Ladybird dashboard can zoom in currently however our digital twin software package can zoom into a digitised map with pin-point accuracy and can accept latitude and longitude readings down to 14 decimal places, so this is extremely accurate in comparison.
Here is the setup page for a similar sensor in our digital twin software and as can be seen we can enter coordinates of up to 14 decimal places as pictured below.
Importance of a Digital Twin for Plumpton College
The Trimble Geo 7X handheld device that I assume Seb from Vinewatch has purchased is capable of delivering centimeter-level accuracy when used with appropriate correction services such as Trimble VRS™ or post-processing in Trimble Business Center. This level of accuracy corresponds to approximately7 to 8 decimal places in latitude and longitude coordinates:
-
7 decimal places ≈ 1.1 cm accuracy
-
8 decimal places ≈ 1.1 mm accuracy
The seventh decimal place is worth up to 1.1 cm: this is good for much surveying and is near the limit of what GPS-based techniques can achieve. The eighth decimal place is worth up to 1.1 mm Permanent, corrected, constantly-running GPS base stations might be able to achieve this level of accuracy and will most certainly be needed if the college plan to use ground based robots and drones as mentioned in the meeting. The ninth decimal place is worth up to 110 microns: we are getting into the range of microscopy. For almost any conceivable application with earth positions, this is overkill and will be more precise than the accuracy of any surveying device specified.
https://geomaticslandsurveying.com/wp-content/uploads/2018/11/Trimble-geo-7x-Manual.pdf
https://gis.stackexchange.com/questions/8650/measuring-accuracy-of-latitude-and-longitude
This precision is ideal for applications like:-
Surveying and staking as detailed in an extract from one of Seb’s emails to us all:
Still waiting for the map from Plumpton though so we can’t progress until we have that. Hopefully Richard and Bill will be able to come up with a price for the pole positions.
Just to reiterate, the urgency is for positioning a maximum of 138 completely passive poles. We need to do that this coming week if we possibly can.
At a later date, we will need to extend that to many more – between 20,000 and 40,000 (including the 138!) is the best guess at the moment. It depends on their final decisions on row spacing and post spacing so we’re a bit stuffed for a number until we know those details.Good weekend!
Seb
Sebastian Holmes
Operations Manager
Vinewatch Ltd
-
High-resolution mapping something we cant currently do in Ladybird but we can do in digital twin and IoT platforms like GeoSpaces to provide integration with Ladybird and other third party sensors discussed in our meeting with Vinewatch and where Gareth was going to look into the supply chain of some of the sensors mentioned.
-
A digital twin is a highly detailed virtual representation of a real-world environment.
For Plumpton College, this means creating a precise, interactive model of the campus and surrounding land. This model can simulate real-time conditions, support planning and development, and enhance decision-making across education, land management, and sustainability initiatives.
Why 14 Decimal Places in Coordinates Matter
Our sister platform supports coordinate precision up to 14 decimal places, that’s accuracy down to millimeter or even sub-millimeter scale. Here's why this is crucial:
1. Hyper-Accurate Mapping
-
At 14 decimal places, you can pinpoint a location to within millimeters. This is essential for:
-
Mapping vineyard rows
-
Monitoring plant growth
-
Installing IoT sensors with exact placement
-
As Plumpton College expands its use of AI, robotics, and precision farming, this level of detail ensures the digital twin remains compatible with cutting-edge technologies.
-
High-precision coordinates enable advanced GIS analysis, such as:
-
Microclimate modelling
-
Erosion prediction
-
Water flow simulation
-
-
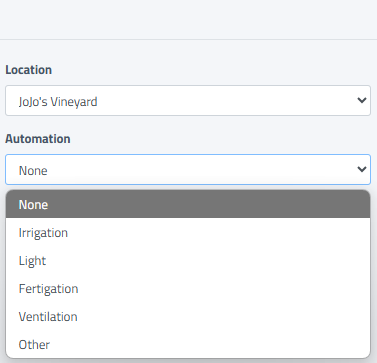
The setup page for the Ladybird is where we can make further adjustments.
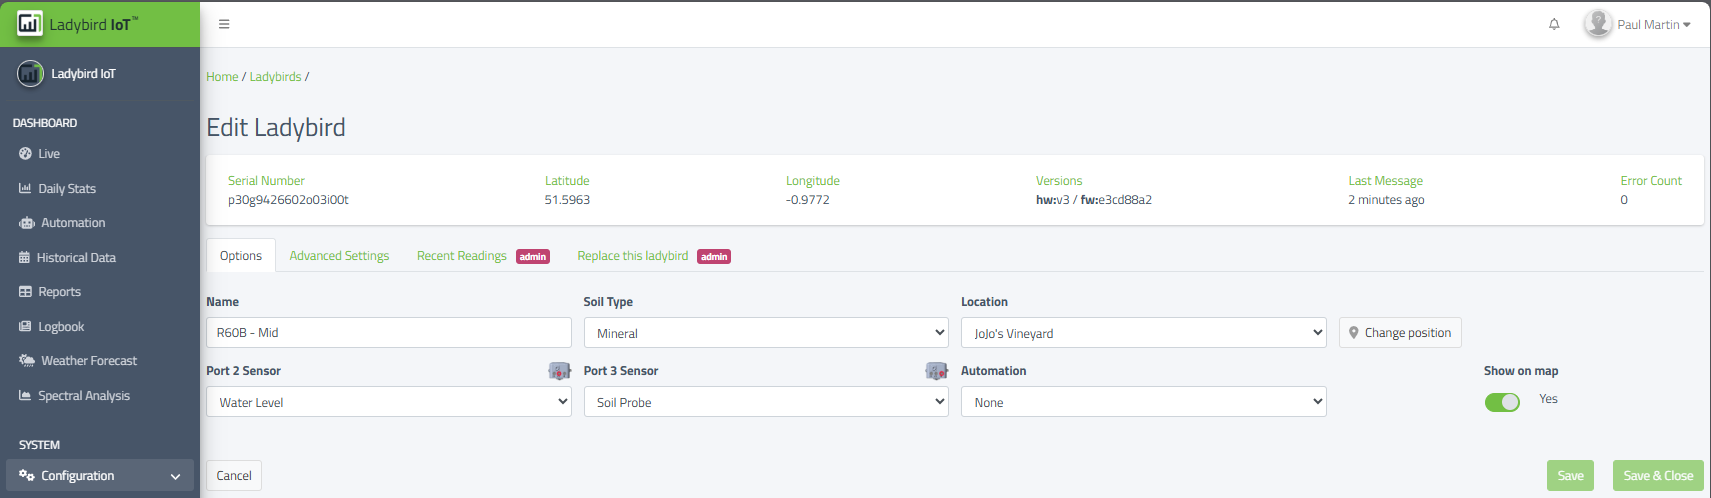
Here in sensor configuration we can set the common name for the device, we can also select from 5 soil different types as pictured below and something that Archipelagos Labs didn't mention in the initial meeting and demonstration of their dashboard.
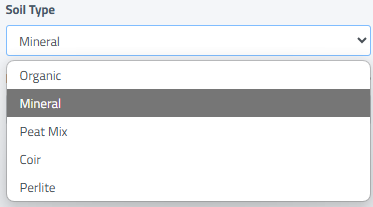
Importance of Soil Type Selection in the Ladybird IoT Dashboard
In the Ladybird IoT dashboard, selecting the correct soil type is critical for accurate sensor calibration, data interpretation, and agronomic decision-making. The dashboard allows users to choose from five soil types:
-
Organic Soil
-
Mineral Soil
-
Peat Mix
-
Coir
-
Perlite
Why Soil Type Matters:
Each soil type has unique physical and chemical properties that affect how sensors interpret data such as moisture, temperature, and electrical conductivity:
-
Organic Soil: Rich in decomposed plant material; retains moisture well but may skew conductivity readings.
-
Mineral Soil: Common in agriculture; has predictable water retention and drainage characteristics.
-
Peat Mix: High water-holding capacity; often used in horticulture but can lead to overestimation of moisture if not calibrated correctly.
-
Coir: Made from coconut husk; excellent for hydroponics and container growing, but has different thermal and moisture profiles.
-
Perlite: Lightweight volcanic glass; used for aeration and drainage, often in mixes—sensors must account for its low water retention.
By selecting the correct soil type, the dashboard can adjust sensor algorithms to provide more accurate readings, which is essential for:
-
Irrigation scheduling
-
Nutrient management
-
Root zone monitoring
-
Environmental modeling
There are a few likely reasons why Archipelagos Labs didn’t emphasize these features in their initial meeting and demo:
-
Focus on Core Functionality: The demo may have prioritised showcasing real-time data streaming, dashboard visuals, or connectivity features over configuration details.
-
Assumption of User Familiarity: They may have assumed that soil type selection and naming conventions were standard practices and didn’t require explanation.
-
Time Constraints: Initial demos often focus on high-level capabilities rather than granular configuration options.
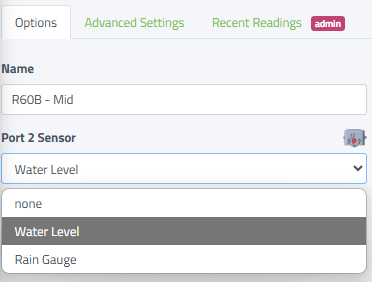
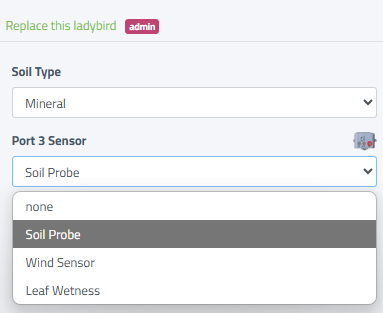
We can however configure the individual ports for additional sensors and even set up some automation that was also mentioned in todays meeting.
|
|
|
|---|
From what I understood from the meeting the vineyard will be digitised to survey level accuracy, so to get cm x cm accuracy an RTK survey must be carried out and the accuracy must be at least 7 decimal places in order to come close to this accuracy.
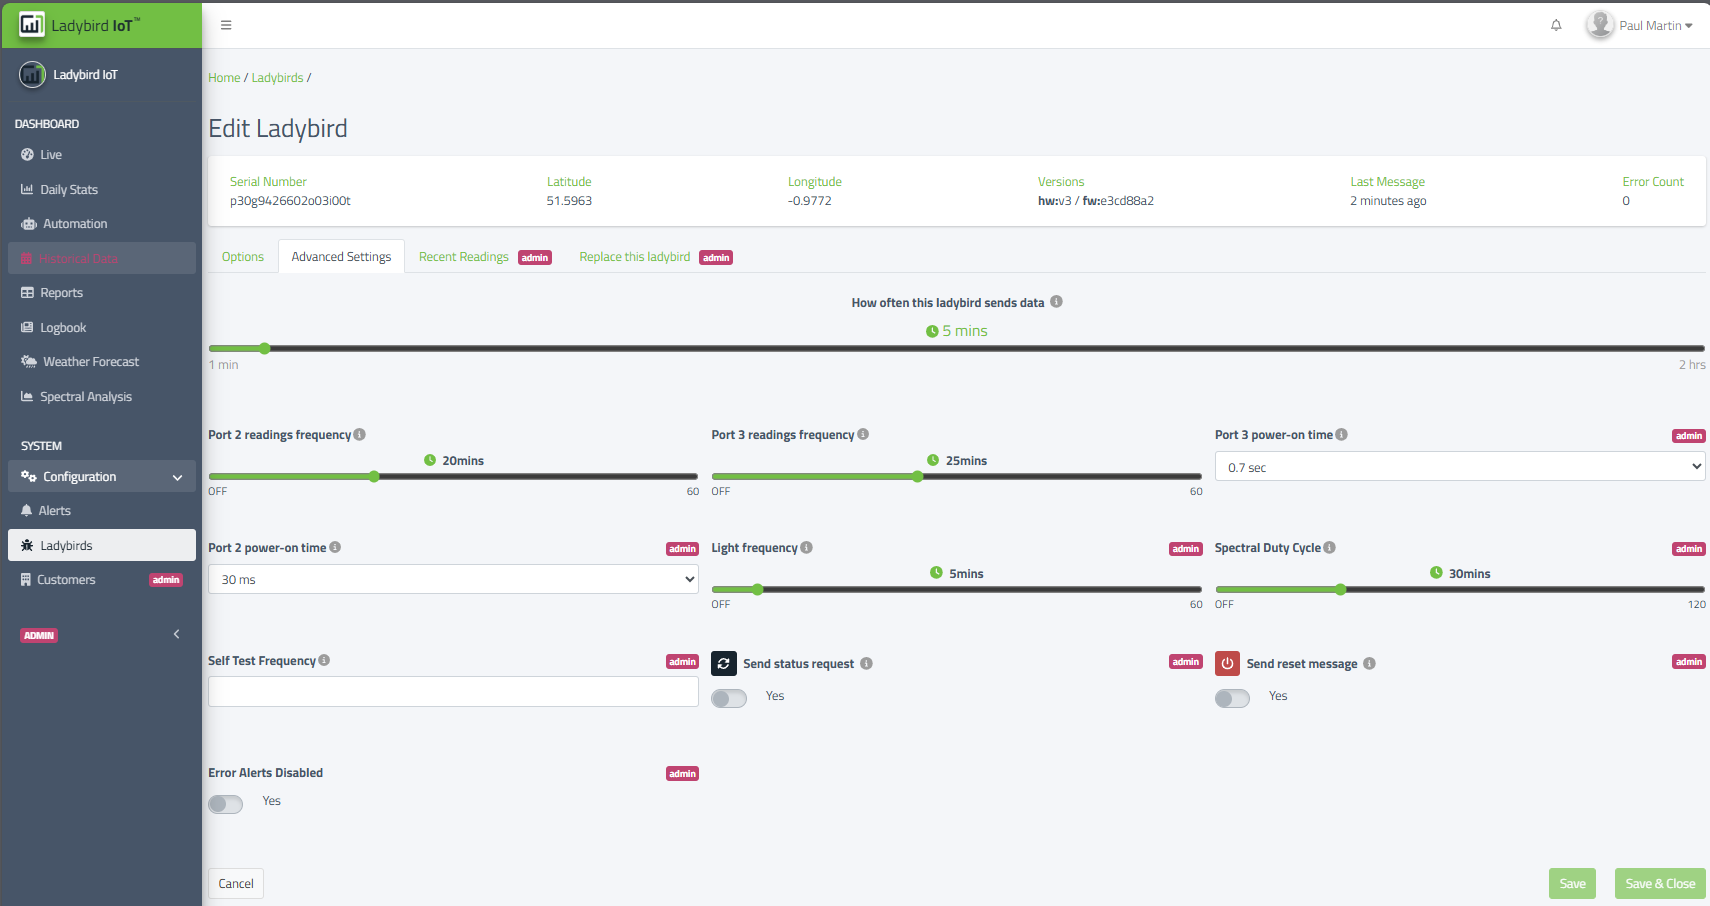
Archipelagos Labs talked about the sensor polling frequencies and we can set these up in a similar way from the advanced settings page below:
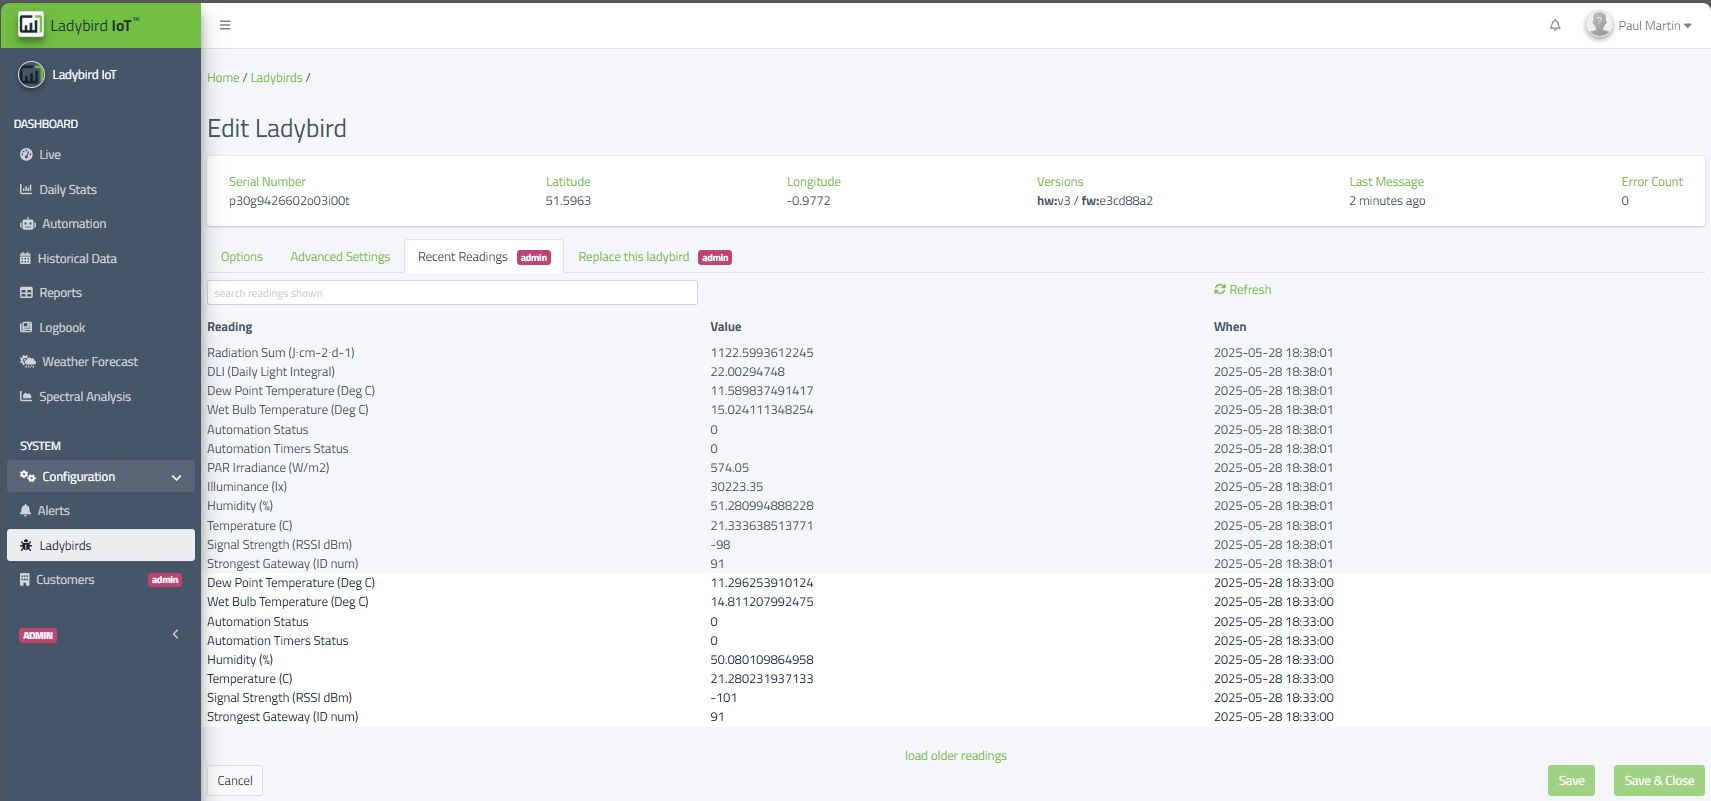
We also have a recent readings tab that is useful to determine that the sensors are polling and that the data is not stale:
If a Ladybird becomes defective, we can simply click on the Replace Ladybird tab and we can enter the serial number of a new ladybird that has not yet been assigned to a location from the stock of Ladybirds sold. This can also be scanned in with a simple QR code reader available from Amazon.

Unlike the demonstration dashboard from Archipelagos Labs where they discussed providing weather predictions 24Hrs ahead, we can predict 4 days ahead with actual Ground Truth Data from the Ladybird sensors installed on site. We can even predict wind direction and speed as well as the barometric pressure, cloudiness, precipitation and even snow.
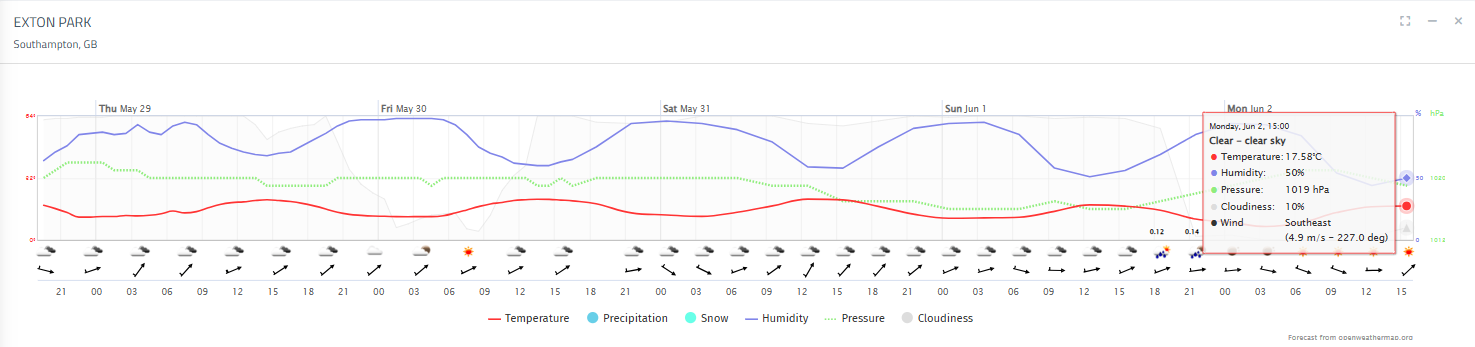
NOTE: Fitting a wind speed and direction sensor and also a tipping bucket rain gauge can increase the accuracy of our “Ground Truth” weather predictions.
The dashboard simulation when viewing sensors resembled a SkySpark-style visualization, a product we sell as sole distributor in the UK. SkySpark is not designed to be a full data science platform. However, you can export data from SkySpark (via REST API, CSV, or Haystack connectors) and analyse it in Python, R, or other tools.
Best of Both Worlds?
Many organizations use SkySpark for real-time operational analytics and Python or R for deeper insights. A common workflow might be:
-
Use SkySpark to detect anomalies or inefficiencies.
-
Export relevant data.
-
Use Python/R to build predictive models or perform deeper statistical analysis.
-
Feed the results back into SkySpark or a dashboard like GeoSpaces.
2. Key Observations and Gaps identified in the meeting
2.1 Data Availability and Baseline Requirements
-
Current Status:
No live data; baseline data collection will begin post-installation of trellises and sensors,
So Archipelagos Labs were unable at this stage to demonstrate a dashboard with live and historic sensor data. -
Gap: ARCHIPELAGOS LABS lacks historical vineyard data.
-
Opportunity: Ladybird IoT can contribute historical environmental and sensor data from similar UK vineyards to establish a robust baseline;
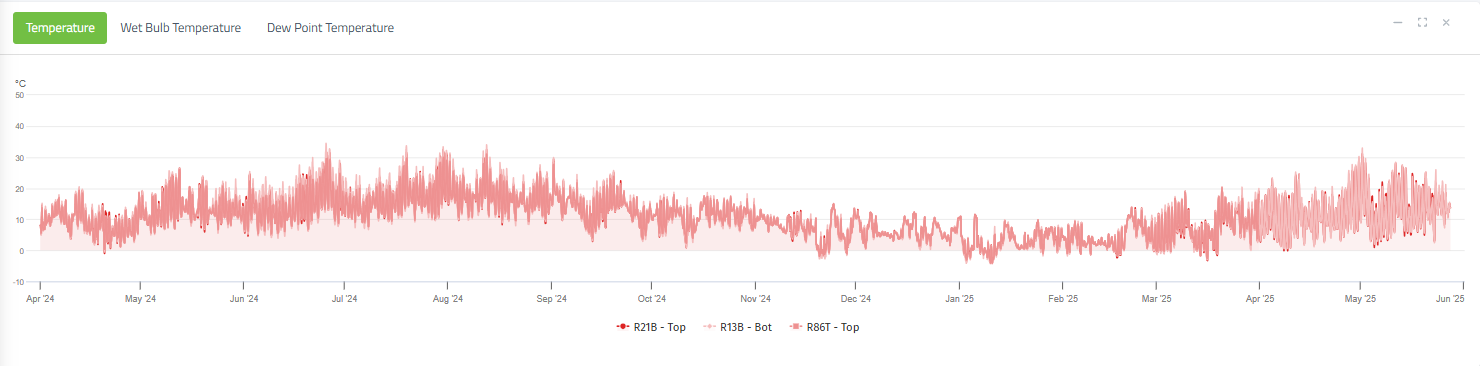
Here is an example of several sensors from one of our customer vineyards over the last month where a frost was warned by Vinewatch UK at a time when the Ladybird databased crashed during some sensor swap outs by Sebastion and the reason Vinewatch had asked if there were any backup plans we could recommend to support them and how I came to discuss a proof of concept temporary solution with Bill while Fabio was on leave.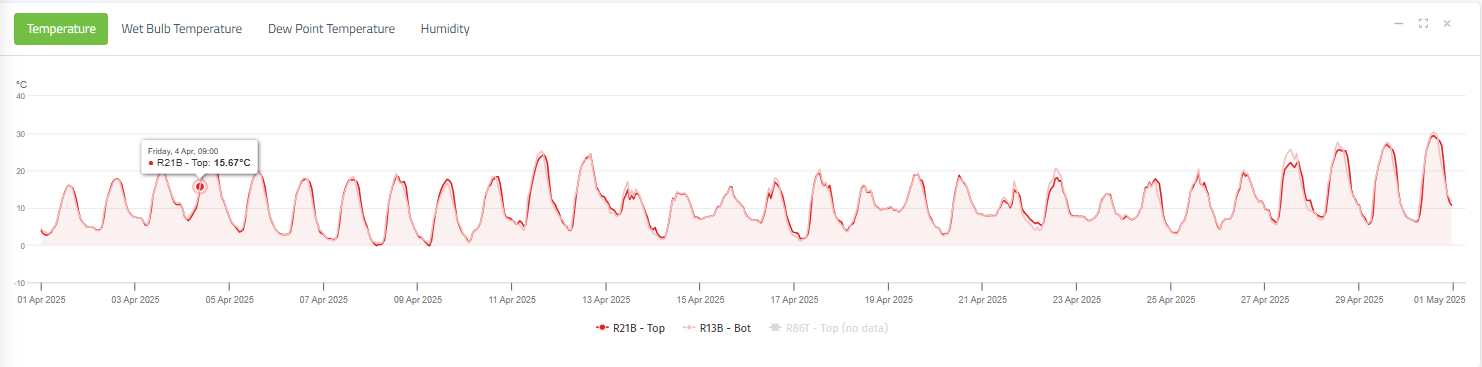
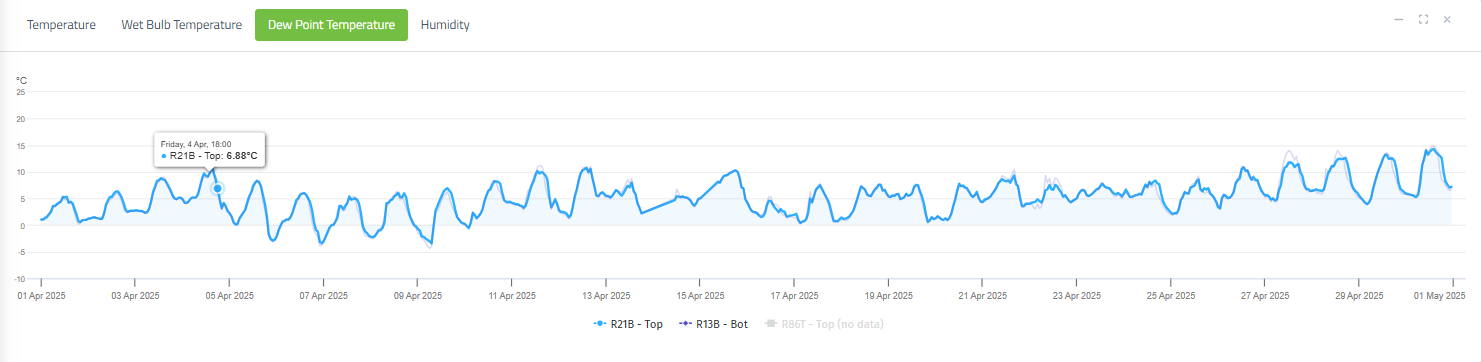
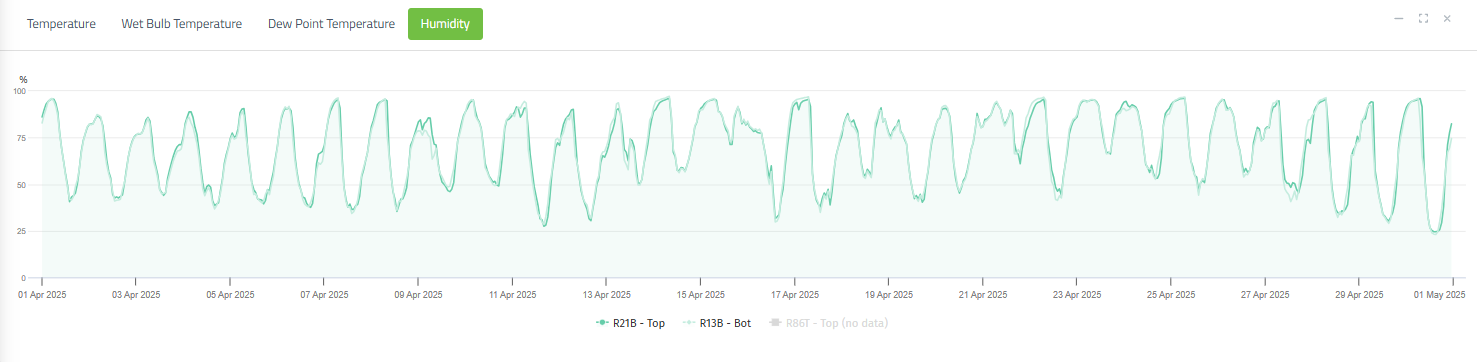
NOTE:
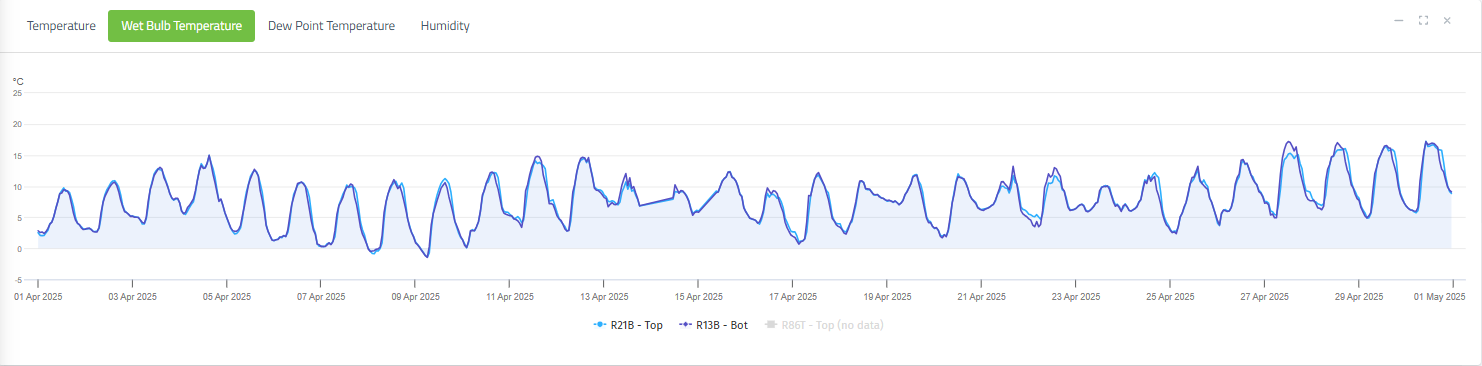
Archipelagos Labs were only able to display temperature actual and humidity and were not demonstrating wet bulb and dewpoint. When predicting frost conditions, it's important to consider a combination of temperature readings rather than relying on a single metric.
-
Actual (Air) Temperature / Dry Bulb Temperature
-
This is the standard air temperature measured by most thermometers.
-
Critical for frost: If it drops to 0°C (32°F) or below, frost can form.
-
However, it doesn’t account for humidity or surface cooling.
-
-
Wet Bulb Temperature
-
Reflects the lowest temperature air can reach through evaporation.
-
Important in irrigation-based frost protection (e.g., in orchards).
-
If wet bulb is above freezing, evaporative cooling can prevent frost.
-
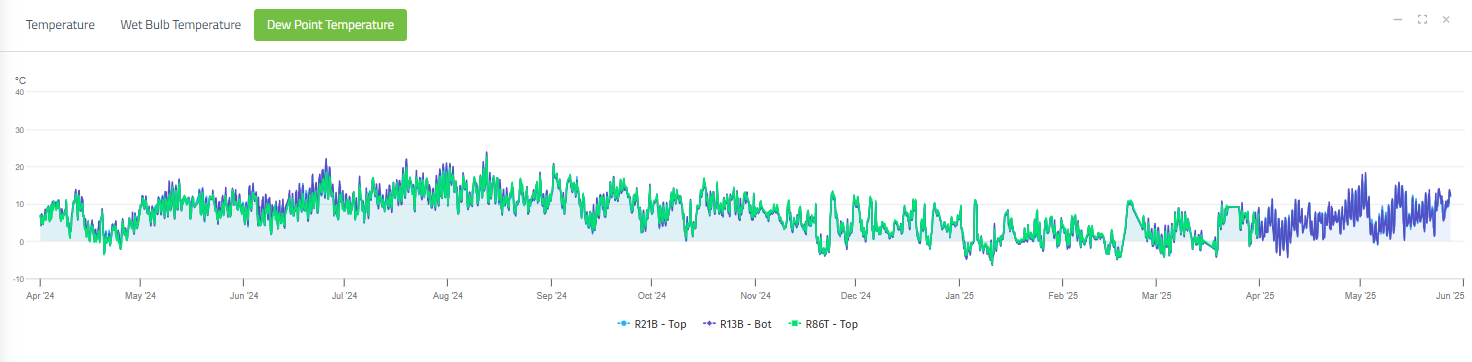
-
Dew Point
-
The temperature at which air becomes saturated and dew (or frost) forms.
-
If the dew point is below freezing, frost is more likely.
-
A low dew point means the air is dry, increasing the risk of radiative cooling and frost.
-
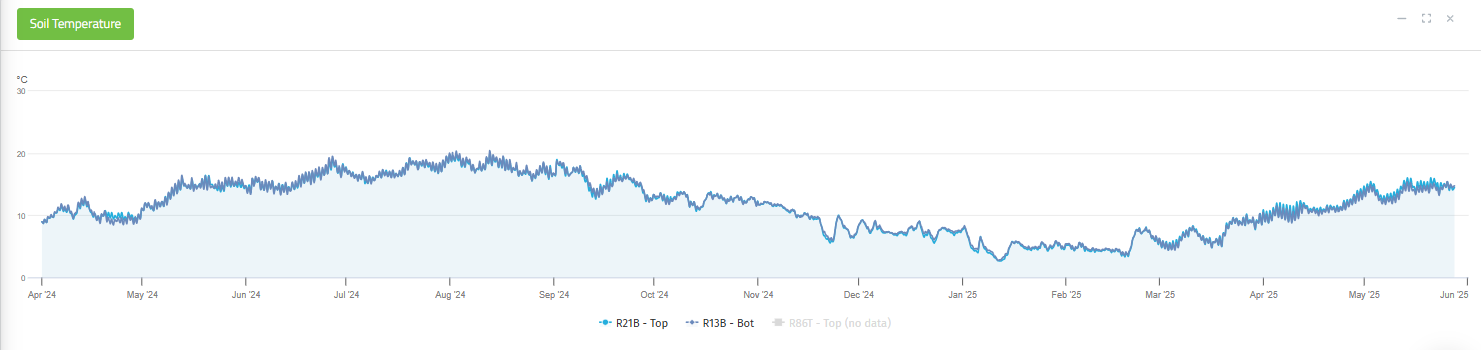
-
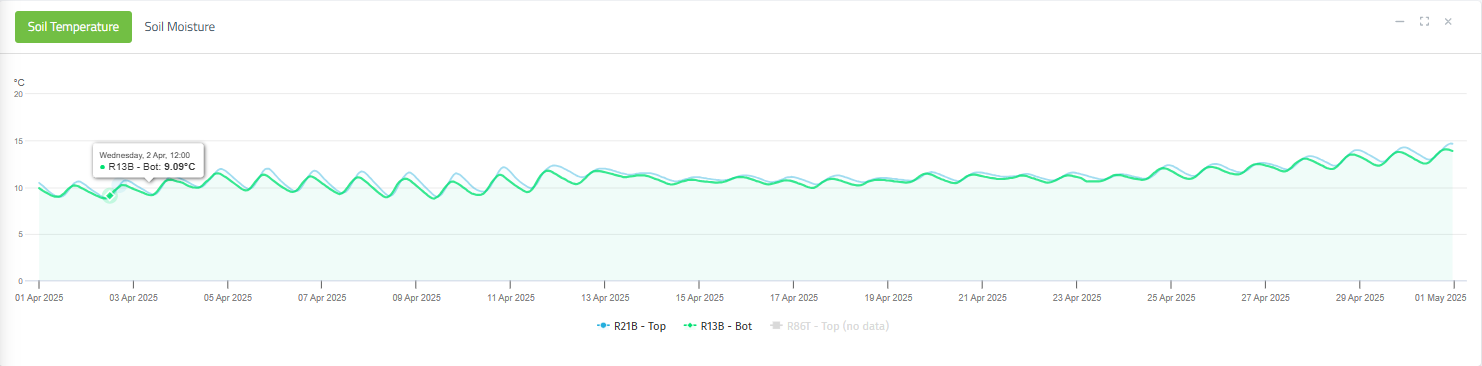
Soil Temperature
-
Helps assess ground heat retention.
-
Warmer soil can radiate heat upward, reducing frost risk near the surface.
-
Useful for predicting frost in low-lying areas or valleys.
-
Best Practice for us but not sure we can do this is to use a combination
For accurate frost prediction, we could or should use a multi-sensor approach:
-
Air temperature (dry bulb) for general frost threshold.
-
Dew point to assess moisture and condensation risk.
-
Wet bulb for irrigation-based mitigation.
-
Soil temperature to understand ground heat flux.
Setting Up Alarms in Ladybird IoT Dashboard
To set up effective frost alerts:
1. Define Thresholds
-
Air temp ≤ 2°C (early warning), ≤ 0°C (critical frost)
-
Dew point ≤ 0°C
-
Wet bulb ≤ 0°C
-
Soil temp ≤ 5°C (supporting indicator)
Create Composite Rules
Use logical conditions like:
IF (Air Temp ≤ 2°C AND Dew Point ≤ 0°C) OR (Wet Bulb ≤ 0°C)
THEN Trigger Frost Alert
Time-Based Alerts
Set alerts for pre-dawn hours (2–6 AM) when frost is most likely.
Escalation Levels
-
Warning: Air temp 2–3°C
-
Watch: Air temp ≤ 1°C + Dew Point ≤ 0°C
-
Alert: Air temp ≤ 0°C + Wet Bulb ≤ 0°C
These are all things I believe Ladybird can or could do right now and we will be able to demonstrate this in a few weeks when we will be invited down to Plumpton.
-
Ladybird Dashboard Current Failings:
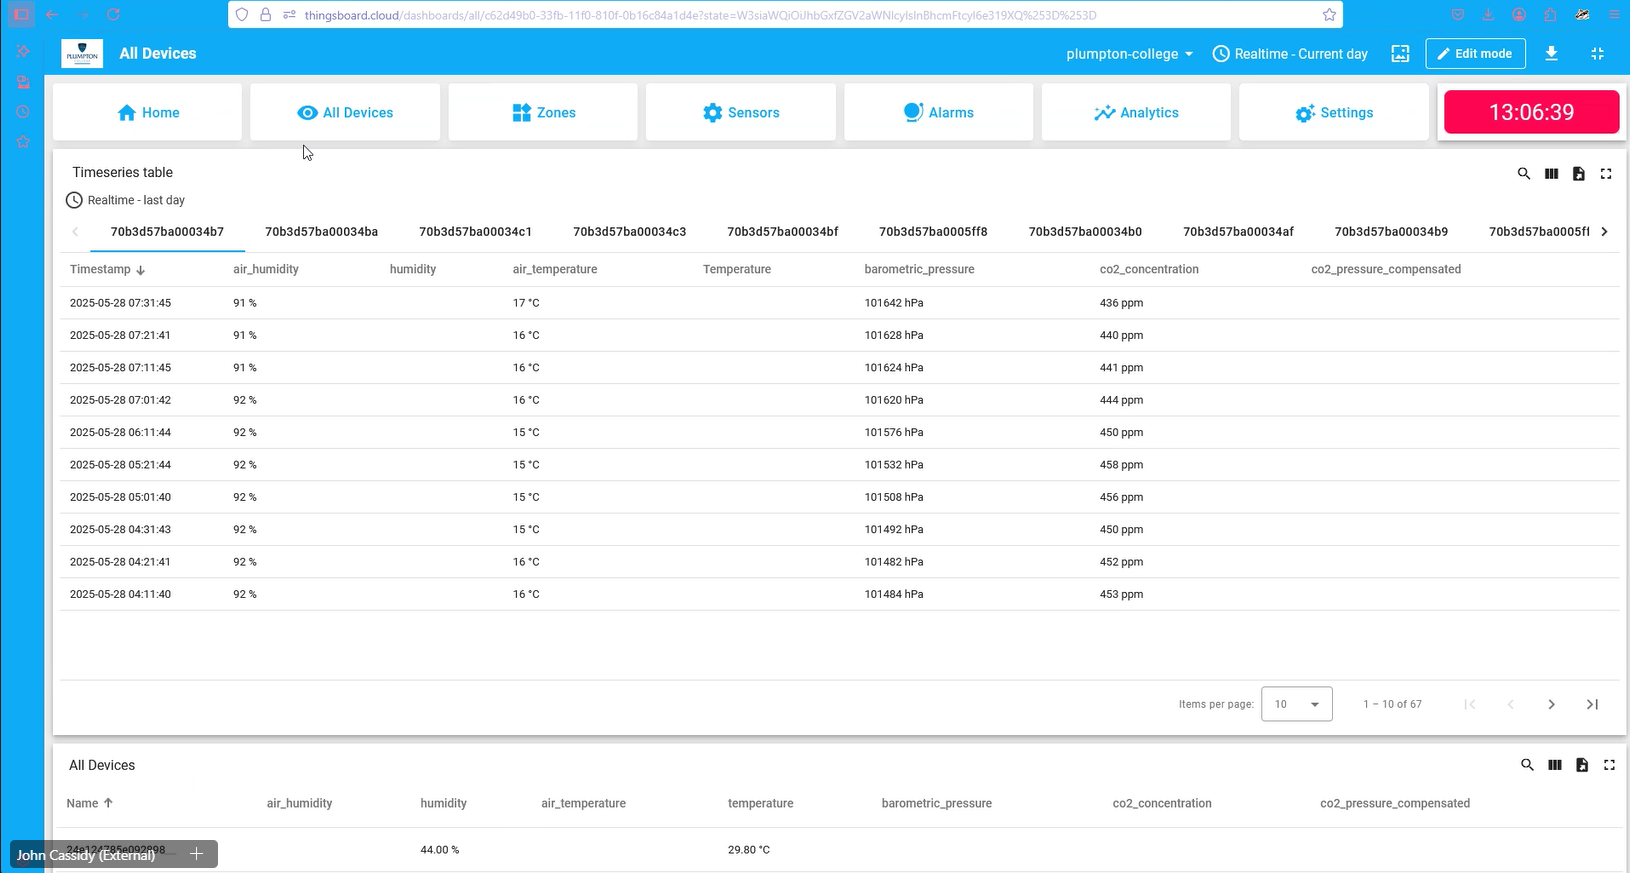
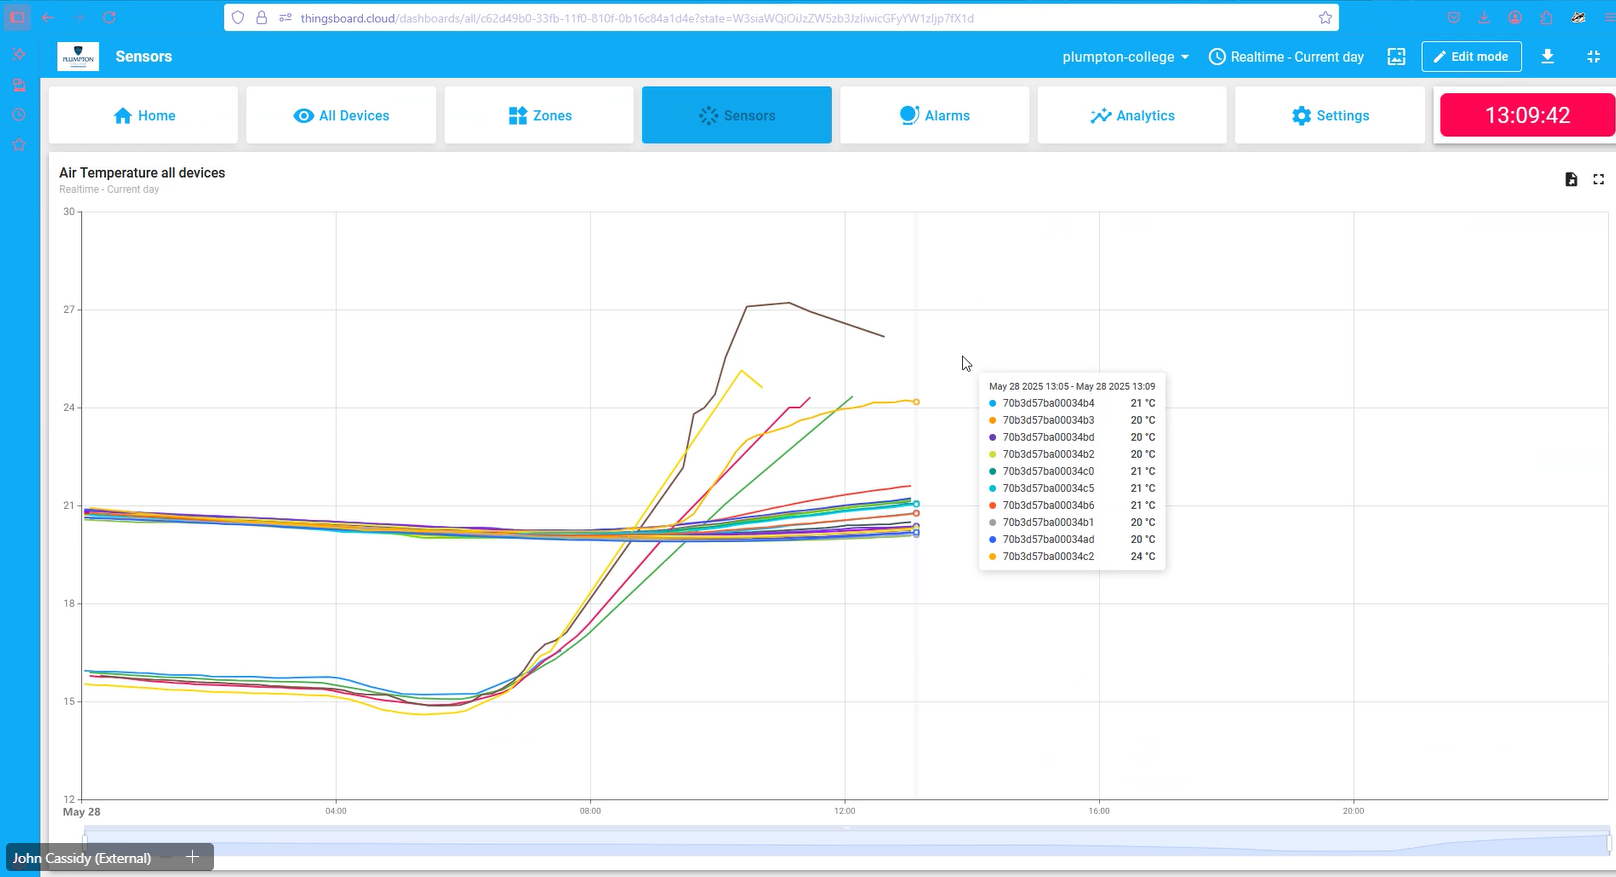
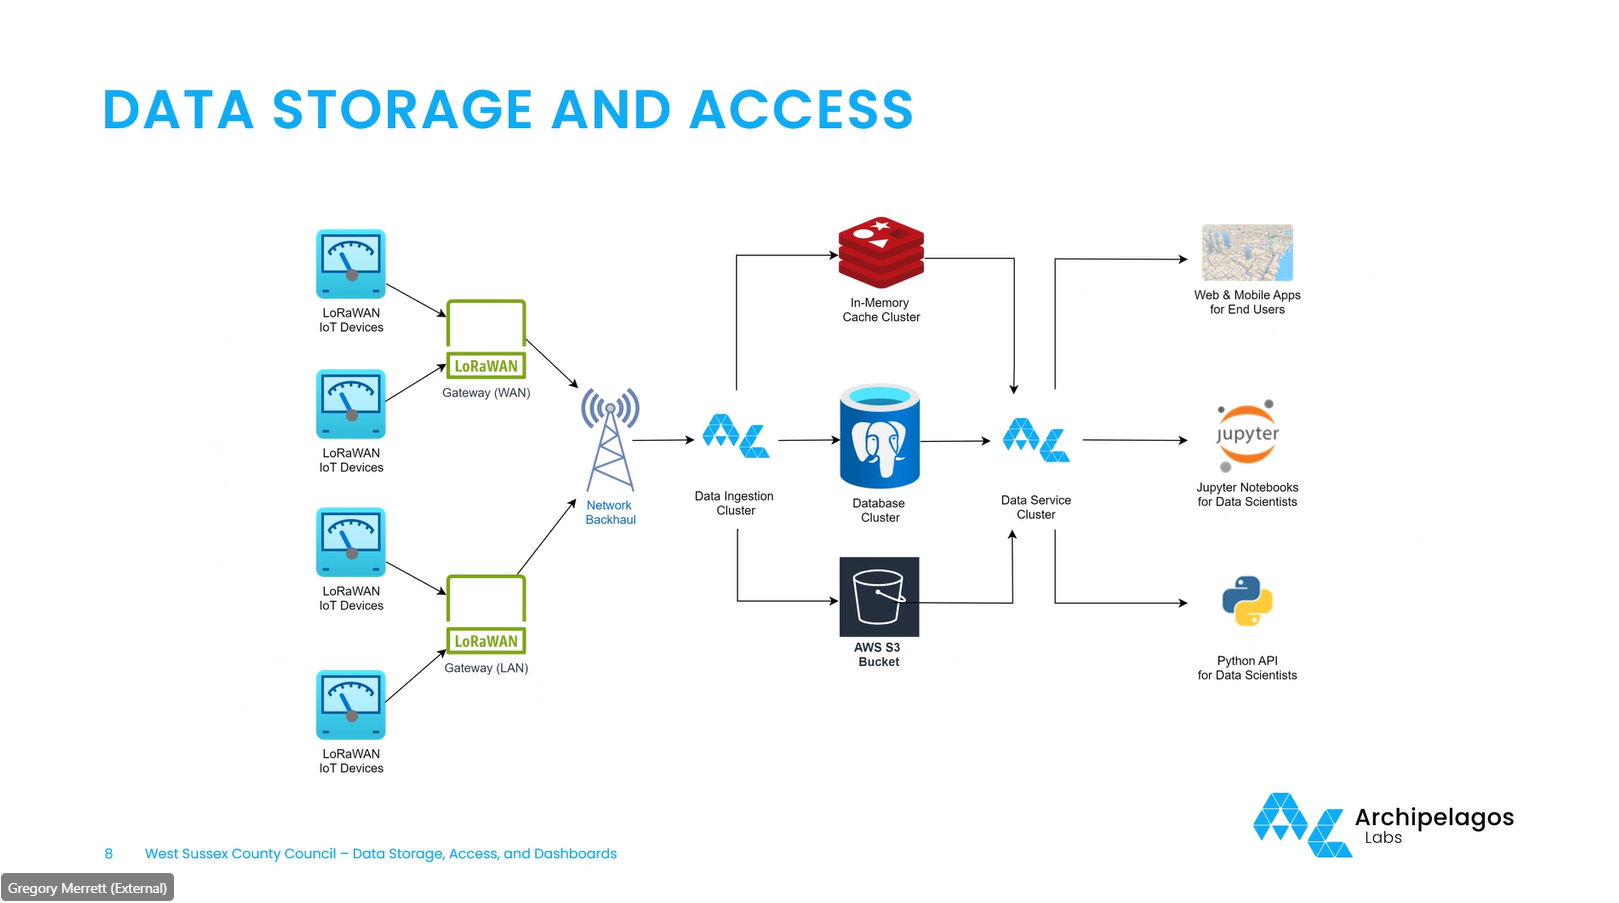
One thing Ladybird cannot do and something Archipelagos Labs claimed they were able to do is get historical data very quickly due to their architecture design of the database as pictured below as academics do not like waiting around for data to arrive and when I tested Ladybird dashboard and asked for the last 12 months data from the same set of sensors I was presented with an error message, so this may be where GeoSpaces or SkySpark could step in to provide quick and accurate data.
-
Ladybird dashboard was asked to provide the last 12 months data from the same sensors and initially it failed with error messages but after a third try it produced a graph with the required data as can be seen below
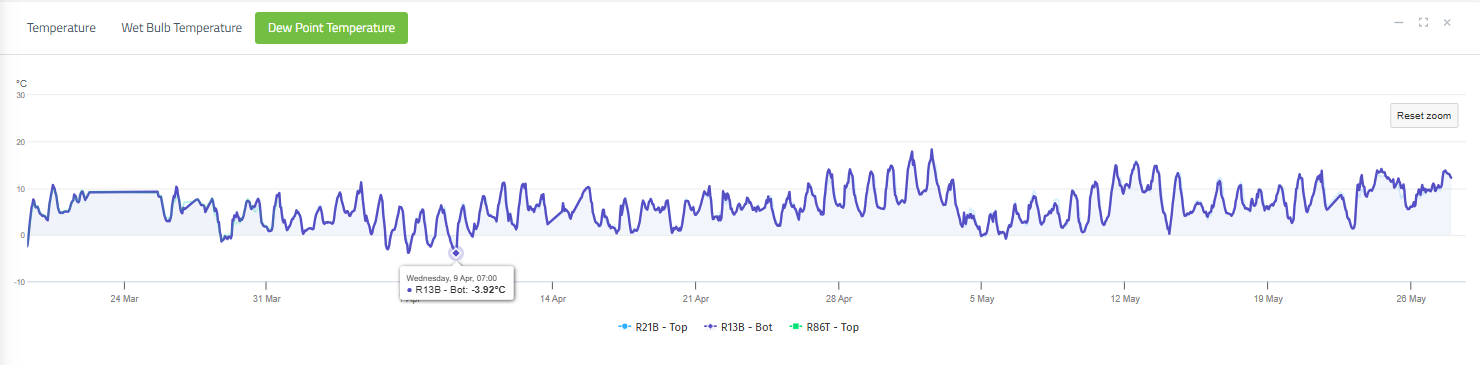
We are able to hover over the data and see the values recorded
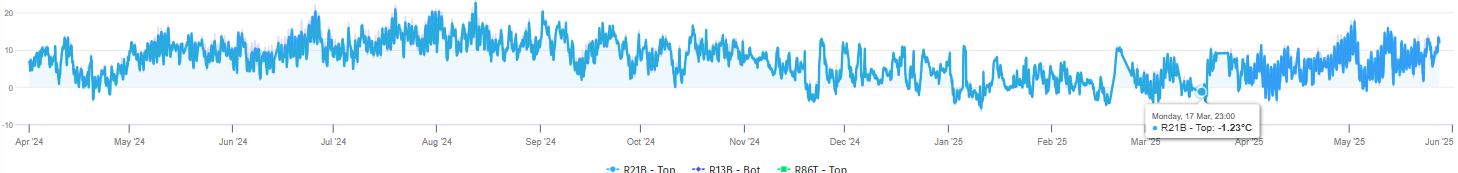
We can also select a section of the data as shown below to then zoom in for more detail.
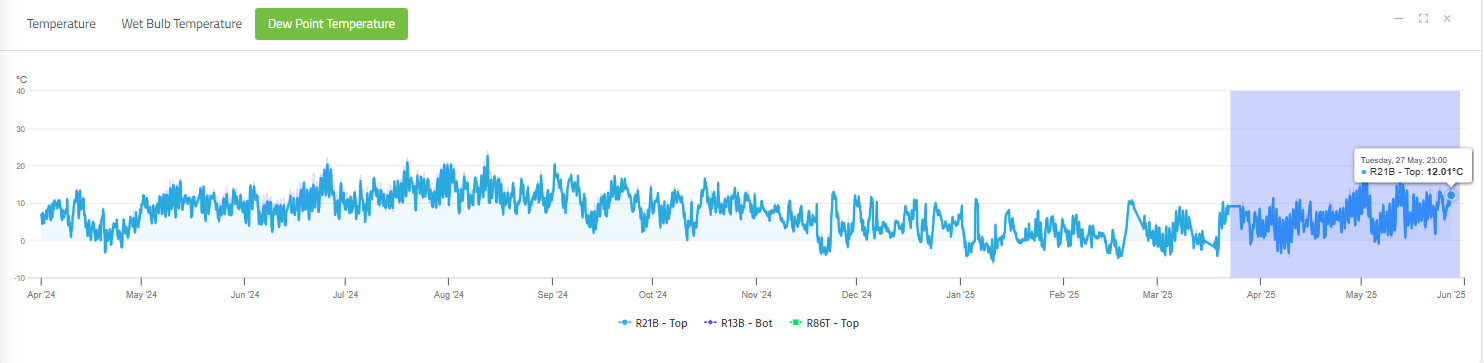
Here is the zoomed in selected data set.
-
-
-
GeoSpaces can overlay that data with other external data such as satellites and other 3rd party sensors not yet able to be integrated with Ladybird IoT,
-
-
-
-
however the historical data needs to be accesses quickly upon request and not take 15mins or more to produce a chart as pictured below for Ladybird over a 12 month period.
The other reason for using GeoSpaces is that we can segregate the data we have to share with Boldyn and Archipelagos Labs by creating a separate database of the 14 or so selected Ladybirds and provide that data to them via a separate dashboard API from Ladybird.
2.2 Dashboard Customization
-
Plumpton’s Need: Customizable dashboards for academic and industry engagement.
-
Current Limitation: Ladybird’s dashboard lacks native customization.
-
Recommendation: Integrate Novacene GeoSpaces’ digital twin capabilities to enable modular, user-defined dashboards. SkySpark’s flexibility can also be leveraged.
3. Technical Enhancements and Capabilities
3.1 Sensor Integration and Automation
-
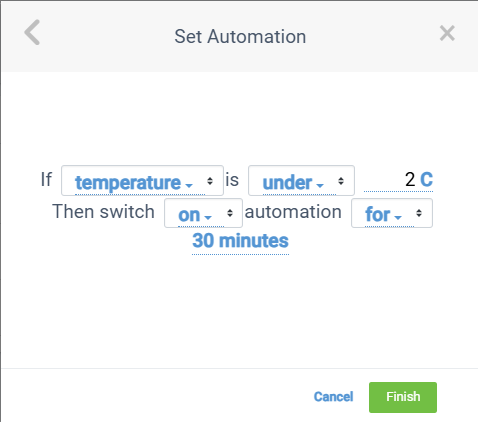
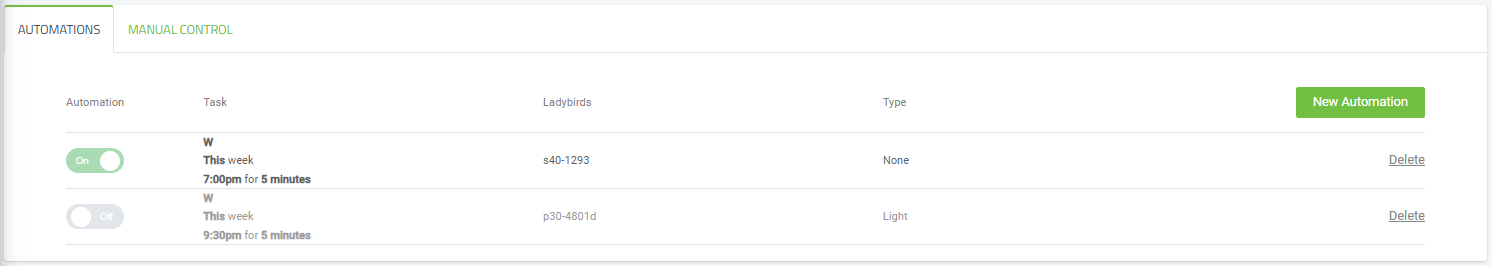
Current Capabilities: Ladybird supports automation for irrigation, fans, and heaters, whereas automation was not mentioned by . We can set up simple timed automation or a smart automation as pictured below
The Ladybird dashboard lets you have an overview of all current automations configured and whether they are active or not.
-
Future Scope:
-
Automate drones/robots using geolocation data for visual inspections (e.g., grape/bud counting).
-
Integrate NDWI indices and satellite-derived heat/water flow maps.
-
Enable RAG (Red-Amber-Green) reporting on vine health and environmental conditions.
-
3.2 Pest and Disease Detection
-
True Pest AI: Requires 10,000+ high-quality images for pest detection.
-
Ladybird Potential:
-
Use environmental thresholds (humidity, temperature, leaf wetness) to predict pest pressure.
-
Develop rule-based alerts for pest-prone conditions.
-
Incorporate leaf wetness sensors to model disease pressure (e.g., mildew, botrytis).
-
3.3 Soil and Subsurface Monitoring
-
Current Sensors: Delta-T SM150-T.
-
Proposed Upgrade: Delta-T WET150 for NPK and conductivity.
-
Benefits:
-
Detect subsurface water flow.
-
Correlate nutrient levels with vine health and yield.
-
Improve intervention strategies (e.g., targeted fertilization).
-
4. Data Science and Academic Use
4.1 Tools and Platforms
-
Brighton University Preference: Python APIs and Jupyter Notebooks.
-
Alternative: Forest Rock’s Energy Manager and SkySpark for real-time analytics and automation.
-
Recommendation: Provide dual access—raw data via APIs for data scientists and visual tools for operational staff.
4.2 Learning and Insight Platform
-
Governance: Awaiting DSIT’s data policy (Parts 1 & 2).
-
Academic Use:
-
Enable scenario-based learning (e.g., frost events, irrigation impact).
-
Record interventions and outcomes to build a feedback loop for machine learning models.
-
5. Strategic Recommendations
-
Historical Data Integration: Curate and contribute Ladybird’s historical vineyard data to seed the baseline dataset.
-
Custom Dashboard Development: Collaborate with Novacene to build a modular, digital twin-enabled dashboard.
-
Pest Pressure Modeling: Develop environmental condition-based pest prediction models using Ladybird data.
-
Sensor Upgrade Strategy: Transition to WET150 sensors for enhanced soil analytics.
-
Academic Engagement: Provide APIs, Jupyter integration, and SkySpark dashboards to support diverse user needs.
-
Yield Optimization: Focus on correlating interventions (e.g., irrigation, fertilization) with yield improvements using machine learning.
6. Conclusion
The Plumpton College project presents a unique opportunity to showcase the power of integrated IoT, digital twins, and data science in viticulture. By leveraging Ladybird’s sensor capabilities and Novacene’s spatial intelligence, we can deliver a truly data-driven, customizable, and scalable solution that meets both academic and industry needs.
Seb from Vinewatch stated in an email to me titled: Plumpton College - The SMART Vineyard They spotted the opportunity to help Plumpton get the government money (albeit under the 5G label!) and both Plumpton and the government leapt at it. So much so that there was nowhere near enough budget within the original spending round for their initial proposal. They therefore chucked it out of that spending round and the government created a new budget especially for this project.
So far Vinewatch know, there is nothing like it anywhere else in the world!
Extract from Seb’s email:
There was not time to fully explain the unique circumstances of this project in the meeting we had so I thought it might be helpful to explain just how special this whole project is. It is all about being in the right place at the right time.
-
Vines are planted in the spring.
-
The vines are ‘grown to order’ so you have to place your order a year before you want to plant.
-
Normally, the vines are chosen using background geological maps and historical weather data and some soil testing. While the overriding parameters for the choice of vine varieties are commercial (taste of the grapes, type/style of wine etc.) these three factors dictate the final choice of the plants.
-
Inevitably, the geological maps, historical weather and, to a lesser extent soil testing are pretty broad brush – an awful lot better than nothing but equally only of limited help. The object of The SMART Vineyard is to attempt to make the data on which the vine selection is based, and the subsequent management of the vines, far more granular and hopefully far better as a result.
-
So, the plan is to install the sensors now, order the vines next spring (2026) and plant in spring 2027. The idea is to use the very latest soil testing kit now to get a far more detailed soil analysis than has ever been possible before and to install the Ladybirds to gather data over a whole year (although it won’t quite be that long as things have slipped) on which to base the choice of vines.
Historically, vineyards simply have not had the luxury of gathering this data over this period of time, or in this quantity so you can see that it is really a unique project.
The total area of the two fields to be planted is 10.56 hectares and we are proposing 114 Ladybirds to cover that area, so 10.8 Ladybirds per hectare (we tried for more but they wouldn’t wear it).
Both fields have wheat growing in them currently so we are going to install the Ladybirds in the next week or two and then we will have to remove them (and then replace them) two or three times for the farmer to spray or harvest the crop and for it to be prepared for planting but, they will be positioned using RTK GPS so we’re confident that positioning won’t be a problem.
There is a confusing twist. For political reasons, they are going to plant up a small area, using between 10 and 14 Ladybirds, early. It need not concern you unduly but thought you’d like to know. We plan to put leaf wetness sensors in that area first. We have yet to decide on the benefits of fitting leaf wetness sensors to the poles in the rest of the wheat fields but they are definitely planned to be installed once the vines are fully planted.
Some further information I researched about the DSIT 5GIR programme
The project is funded by the DSIT 5GIR programme, which emphasizes data governance, security, and academic accessibility.
The DSIT 5GIR programme: Short for the Department for Science, Innovation and Technology's 5G Innovation Regions programme is a UK government initiative aimed at accelerating the adoption of 5G and advanced wireless technologies across the country.
The Plumpton College 5-year vineyard project aligns closely with the goals of the DSIT 5G Innovation Regions (5GIR) programme, particularly in the context of agri-tech innovation and sustainable viticulture.
How They Fit Together:
1. Smart Agriculture and 5G Integration
Plumpton College is involved in a cutting-edge project focused on frost risk forecasting and management in vineyards. This initiative uses:
-
IoT sensors for microclimate monitoring,
-
Real-time data for site-specific frost alerts,
-
AI-driven forecasting models.
These technologies are ideal candidates for 5G-enabled infrastructure, which offers:
-
Low latency for real-time alerts,
-
High bandwidth for transmitting sensor data,
-
Scalability for deployment across multiple vineyard sites.
This directly supports the 5GIR programme’s aim to demonstrate scalable, replicable use cases of 5G in rural and agricultural settings.
2. Regional Economic Development
Plumpton College is a key player in the South East England wine industry, which is rapidly growing and projected to employ over 24,000 people by 2040.
The 5GIR programme seeks to:
-
Boost regional productivity,
-
Support rural innovation,
-
Create high-value jobs.
By integrating 5G into vineyard operations, Plumpton can serve as a regional model for how digital connectivity enhances agricultural productivity and resilience.
3. Educational and Research Impact
Plumpton’s Wine Division is also a centre of excellence for wine education, with advanced training and research facilities.
The 5GIR programme encourages partnerships between academia, industry, and government to foster innovation ecosystems—exactly the kind of collaboration Plumpton is already engaged in.
Relevance Summary:
The Plumpton vineyard project exemplifies how 5G and digital technologies can transform traditional industries like viticulture. It aligns with the DSIT 5GIR programme’s goals by:
-
Demonstrating real-world applications of 5G in agriculture,
-
Supporting regional innovation and skills development,
-
Contributing to climate resilience and sustainability in food production.
Key Details:
-
Funding: The programme provides £40 million in funding to support local and regional authorities in becoming designated 5G Innovation Regions (5GIRs).
-
Purpose: It aims to move 5G applications from proof of concept to widespread adoption, focusing on sectors like transport, health, manufacturing, and agriculture.
-
Goals:
-
Demonstrate scalable and replicable 5G use cases.
-
Promote secure and resilient telecom networks.
-
Support a diverse and competitive supply chain.
-
Share learnings and benefits across regions.
-
This initiative is part of the UK’s broader strategy to ensure communities benefit from the transformative potential of digital connectivity and to maintain leadership in telecoms innovation.